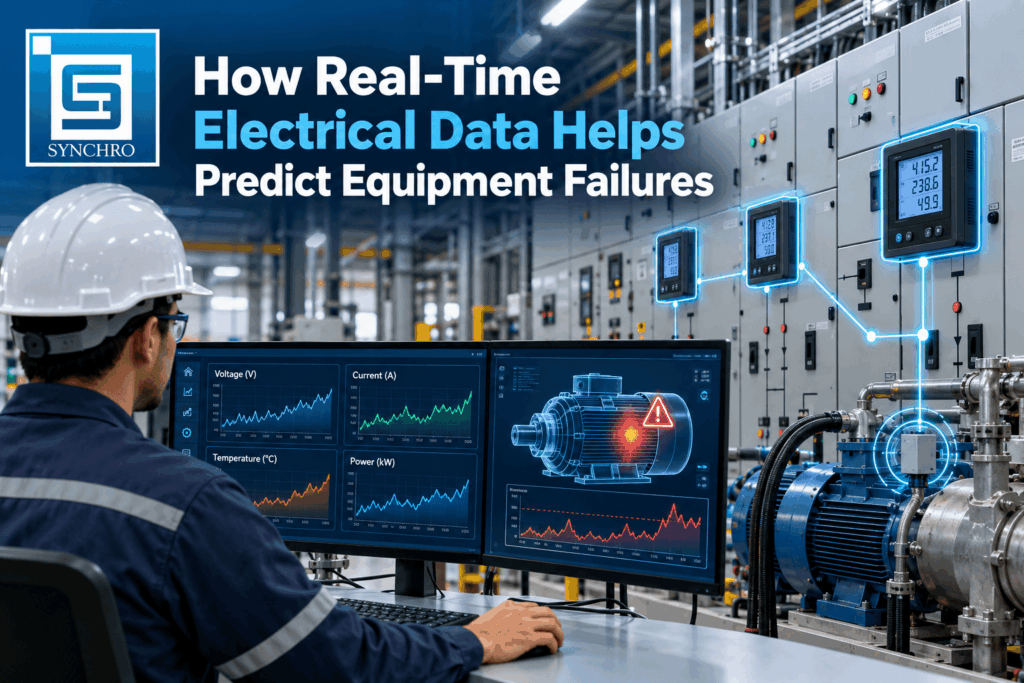
Most equipment failures in a factory are not sudden. A motor that burns out on a Monday night has usually been running hotter for weeks. A capacitor bank that fails had been losing capacity for months. A busbar joint that flashes over had been heating up long before anyone smelled it. The warning signs were there. Nobody was measuring them.
Electrical signals often change before anything visibly breaks. Current creeps upward, phases drift out of balance, harmonics climb, and joints heat up. With real-time electrical data from the panels that already feed your equipment, those changes become early warnings. Maintenance can then be planned around production instead of forced on it. This guide comes from the panel-building side, from the engineering team at Synchro Electricals. It covers which electrical signals predict which failures, how to set up monitoring that people act on, and what your panels need to support it.
Reactive, Preventive and Predictive Maintenance
| Approach | How it works | Main weakness |
|---|---|---|
| Reactive | Repair after failure | Unplanned downtime, secondary damage, emergency costs |
| Preventive | Service on a fixed calendar or run-hours schedule | Healthy parts get replaced; faults between visits are missed |
| Predictive | Service based on measured condition and trends | Needs sensors, data and people who act on alerts |
Predictive maintenance does not replace preventive work. It aims maintenance effort at the equipment whose data shows it needs attention. Electrical data is one of the cheapest places to start, because much of it can be measured at the panel rather than on the machine itself.
What Counts as Real-Time Electrical Data?
In a typical plant, useful electrical data comes from several devices already installed in or near your panels:
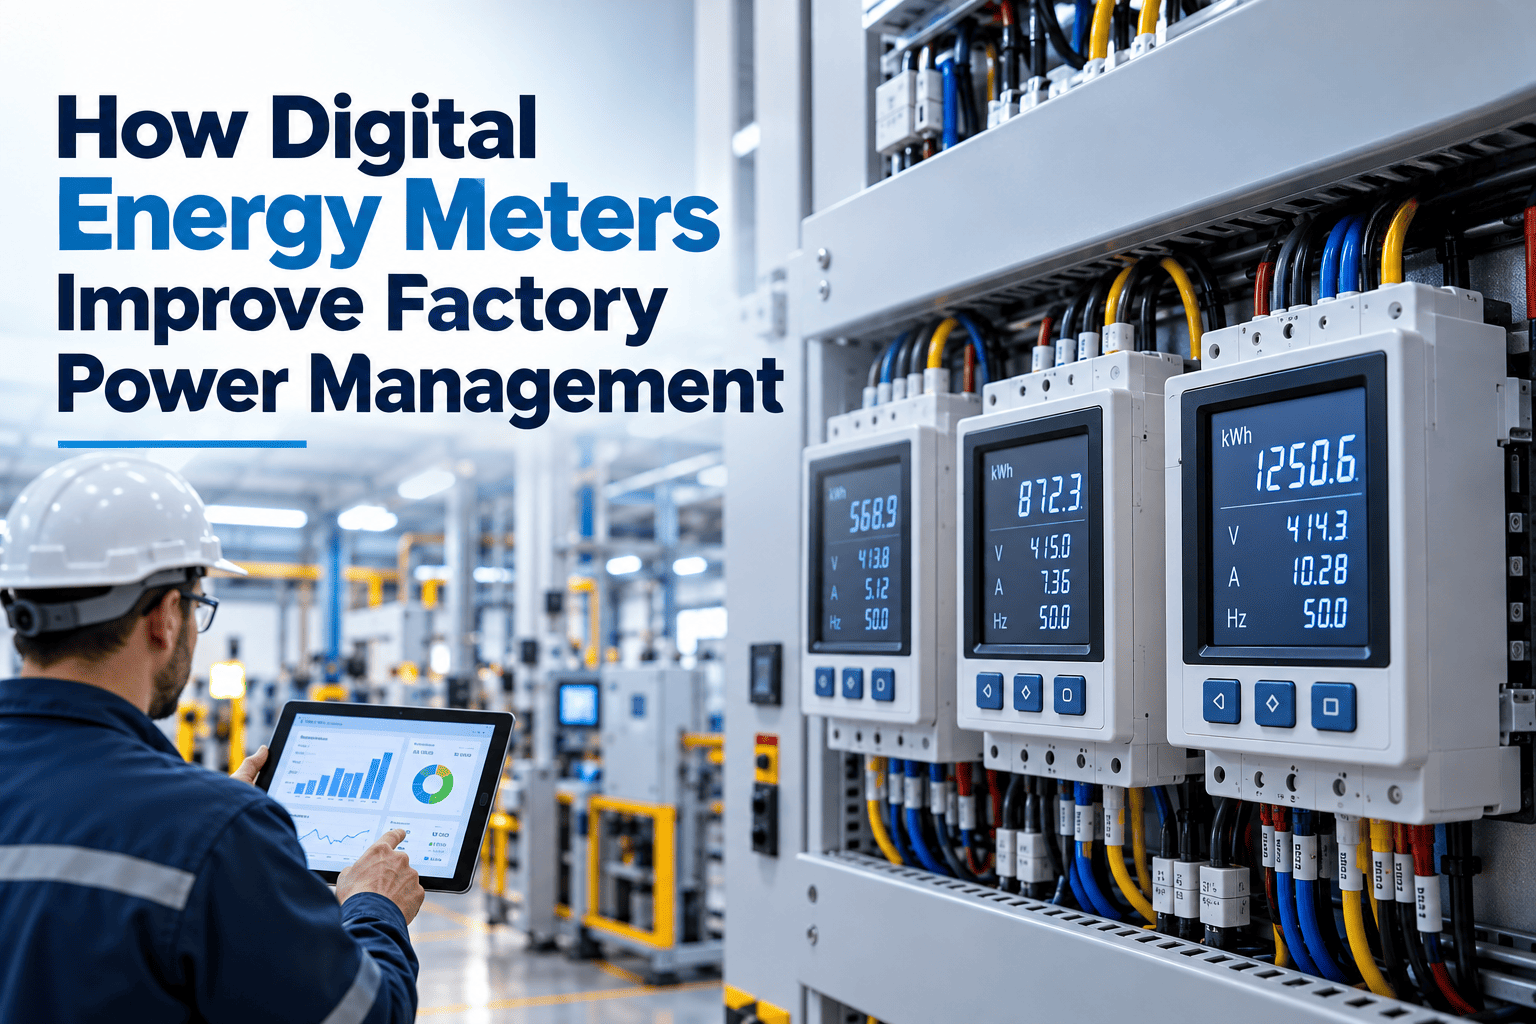
- Multifunction meters (MFMs) on incomers and feeders: voltage, current, power, power factor, energy, demand and THD
- Motor protection relays in the MCC panel: per-phase current, thermal capacity used, unbalance, earth-fault current, starts per hour and trip history
- Variable frequency drives in the VFD panel: output current, torque, DC bus voltage, heatsink temperature and fault logs
- APFC controllers in the APFC panel: power factor, connected kVAr, step switching counts and, on many models, alarms for harmonics or over-temperature
- Breakers with communicating trip units: load current, trip records and, on some models, operation counters
- Temperature sensors on busbar joints, cable terminations and transformer windings
- Partial discharge sensors on HT switchgear and cable terminations, where specified
Monitoring works at two levels. Trend monitoring logs values every few seconds or minutes and watches how they drift over days and weeks. This is where most predictive value lies. Waveform-level analysis, such as motor current signature analysis (MCSA), samples current at high speed to find fault frequencies hidden inside the waveform. It needs specialised instruments or software, but it can detect problems that trends alone miss.
Electrical Warning Signs and What They Predict
| What the data shows | What it can indicate | Equipment at risk |
|---|---|---|
| Running current rising at the same output | Bearing wear, misalignment, clogged impeller, mechanical binding, worn belts | Motors, pumps, fans, compressors |
| Current unbalance between phases | Supply voltage unbalance, high-resistance connection, winding insulation deterioration | Motors, cables, terminations |
| Voltage unbalance above about 1% | Single-phase loads unevenly distributed, a failing transformer tap or connection | All three-phase motors on that supply |
| Fault-frequency sidebands in the current spectrum (MCSA) | Broken rotor bars, air-gap eccentricity, bearing defects | Induction motors |
| Rising voltage or current THD | Growing drive and electronic load; stress on capacitors, transformers and neutrals | APFC capacitors, transformers, neutral conductors |
| Neutral current increasing | Triplen harmonics, unevenly distributed single-phase loads | Neutral conductors, neutral busbar, terminations |
| APFC not reaching target PF; kVAr per step falling | Capacitor degradation, failed contactors, blown fuses | APFC panel |
| Temperature rising at a joint or termination | Loose bolts, oxidation, undersized connection | Busbars, bus ducts, cable lugs, breaker terminals |
| More starts per hour, longer starting times | Process cycling problems, overloaded driven equipment | Motors and starters |
| Partial discharge activity increasing | Insulation defects, contamination, moisture | HT cable terminations, VCB panels |
| Rising trip counts and nuisance trips | Developing faults, wrong settings, ageing breakers | Breakers, relays, feeders |
None of these signals proves a fault on its own. A change from the equipment’s own normal behaviour is what triggers an investigation. That is why baselines matter, as covered below.
Equipment by Equipment: Where Electrical Data Gives Early Warning
Motors and MCC Feeders
Motors drive most of a factory’s critical processes, and their electrical signature says a lot about their health. If a pump motor draws noticeably more current than usual for the same flow and head, something mechanical has changed. Current unbalance that grows over weeks can point to a deteriorating terminal connection or developing winding damage.
Supply quality matters as much as the motor itself. NEMA MG 1 recommends keeping voltage unbalance at motor terminals within 1%, beyond which motors should be derated. A small voltage unbalance can produce a current unbalance several times larger. A widely used rule of thumb holds that every 10°C of extra winding temperature roughly halves insulation life. Real-time voltage monitoring at the MCC incomer catches this before motors start failing early across the plant.
Communicating motor protection relays in the MCC make this practical. They log per-phase current, thermal capacity used, unbalance and earth-leakage trends for every feeder without extra instruments. Our guide to designing MCC panels for VFD motor control systems explains how to plan these feeders.
VFDs and Drive-Fed Loads
Drives are themselves a rich data source. A rising heatsink temperature at steady load points to blocked filters, failing cooling fans or high panel ambient temperature. DC bus voltage behaviour and logged fault codes can reveal supply disturbances or ageing DC bus capacitors. Torque and current trends at fixed speed reflect the condition of the driven machine. Panel ventilation design matters here, because heat is one of the main causes of drive failure.
APFC Capacitor Banks
Capacitors age. Their capacitance falls over time, faster under heat, over-voltage and harmonic stress. A real-time PF and kVAr record at the incomer shows when the panel can no longer reach target PF, often well before a capacitor visibly fails. Rising THD warns that standard capacitors may be at risk and that a detuned reactor design may be needed. Routine step-wise current checks by maintenance staff complement the trend data.
Transformers, Incomers and PCC Panels
At the PCC panel incomer, long-term load, harmonic and unbalance data shows how hard the transformer is working. Sustained loading near rating, high harmonic content and phase unbalance all add heat. Combined with winding temperature indication, this data helps plan load redistribution or capacity upgrades before overheating shortens transformer life.
Busbars, Joints and Bus Ducts
Loose or oxidised joints have higher contact resistance. Higher resistance produces more heat, and heat speeds up further oxidation. Without intervention, this loop can end in a burnt joint or an arc fault. Periodic thermography catches some of these problems, but only on the day of the survey. Continuous temperature sensors on critical busbar joints, outgoing terminations and LT sandwich bus duct joints give round-the-clock warning. Our article on bus duct vs cable distribution covers where bus ducts make sense.
HT Switchgear
In HT systems, insulation problems at cable terminations and inside switchgear often show partial discharge activity before a breakdown. Where the risk justifies it, PD sensing alongside temperature monitoring at a VCB panel can warn of developing insulation faults. The specification should come from your electrical consultant, based on voltage level and how critical the supply is.
DG Sets and Transfer Systems
Generator voltage and frequency stability during load steps, battery voltage before cranking, and start-attempt counts all show whether backup power will work when needed. An AMF panel controller with event logging gives this data, as does a synchronizing panel on multi-generator sites. See how AMF panels work with industrial DG sets for more detail.
Solar Plants
On solar sites, string current monitoring through a string monitoring box shows underperforming strings, blown fuses and soiling patterns as they develop. Our comparison of SCB vs SMB in solar plants explains how monitoring affects long-term performance.
How to Turn Data Into Predictions
Record a baseline at commissioning. Readings taken during factory acceptance and site acceptance tests are each machine’s healthy reference: running current at known load, phase balance, starting time and joint temperatures. Our guide to electrical panel FAT vs SAT explains which readings to capture at each stage.
Watch trends, not snapshots. One high reading means little. A steady rise over three weeks means a lot. Compare like with like: the same machine, at the same load, under similar ambient conditions.
Set alarms in two stages. A warning level starts an investigation. A critical level calls for planned intervention. Base thresholds on each asset’s own baseline and the manufacturer’s limits rather than generic numbers.
Link alarms to action. Every alarm should have an owner and a response, ideally logged as a maintenance work order. Monitoring that produces alerts nobody reads adds cost without reducing risk.
Cross-check with other methods. Vibration analysis, thermography, oil analysis and insulation resistance testing confirm what electrical data suggests. Each method catches faults the others miss.
Start small. Begin with the assets whose failure would stop production: main incomers, the largest motors, the APFC panel and critical busbar joints. Expand once the team trusts the data and has routines to act on it.
What Your Panels Need to Make Prediction Possible
Predictive monitoring is far cheaper to build into a panel than to retrofit. When specifying new panels, discuss these provisions with your panel builder:
Measurement points: meters and CTs on the incomer and every major feeder, with accuracy suited to the purpose. The digital energy meters guide covers meter and CT selection. (Activate this link once that post is live.)
Communicating protection: motor protection relays and breakers with communication ports where per-feeder diagnostics justify the cost.
Sensor provisions: mounting points, cable routes and terminals for temperature sensors at critical joints and terminations.
Communication backbone: RS-485 or Ethernet wiring routed away from power and drive output cables, with a documented address and register map for every device.
Thermal design: adequate ventilation or cooling for drives and capacitors, since heat speeds up nearly every failure mode in this article.
Wiring and labelling discipline: clear terminal and ferrule labelling makes alarms traceable to the right device. See our panel wiring design best practices.
Verified construction: properly torqued, marked joints and verified assemblies prevent many of the thermal problems monitoring is meant to catch. Our guide to IEC 61439 verification explains what buyers should check.
What Electrical Data Cannot Do
Electrical monitoring is powerful, but it has limits.
- Not every fault shows up electrically. Some mechanical faults show up in vibration long before they affect current.
- Drive-fed motors are harder to analyse. Current signature analysis on motors fed through VFDs needs more careful interpretation.
- Thresholds need tuning. Badly set thresholds cause alarm fatigue.
- Monitoring is not protection. Your protection system still has to be correctly designed and coordinated. Read how fault-level calculations influence switchgear selection.
Treat electrical data as one input to maintenance decisions, not an automatic verdict.
Why Work With Synchro Electricals
Synchro Electricals is an electrical panel manufacturer based in Rajkot, Gujarat. It has designed and built LT and HT panels for industrial, solar, infrastructure, commercial and government projects since 2018. Every panel is engineered to the project’s specification. Monitoring requirements such as metering points, communicating devices, sensor provisions and communication wiring can be built into the design from the start, if you include them in your brief.
- Design approval first: technical drawings and panel specifications go to you for written approval before manufacturing begins.
- Every panel tested: high-voltage, insulation resistance and functional tests are carried out, and a test report is supplied with each order. These records also serve as your commissioning baseline.
- Verifiable credentials: our certifications include ISO 9001:2015, and CPRI type testing is listed among our credentials. Our 800Vac Solar Type-Tested Panel holds type-test certification to IEC 61439. For other panels, ask which verification route applies to your rating.
- Clear timelines: 3 to 6 weeks for standard panels and 6 to 10 weeks for custom-designed panels, confirmed in writing at order.
- Support after delivery: documentation, commissioning guidance and ongoing technical support.
Explore our product range or learn more about us.
Conclusion
Equipment rarely fails without warning. It just fails without anyone noticing the warning. Rising current, phase unbalance, harmonics, falling capacitor output and warming joints are all measurable at the panel, often weeks before a breakdown. Record a baseline at commissioning, watch trends, set sensible alarms and give every alert an owner. Real-time electrical data can then turn breakdowns into planned repairs. And the cheapest time to make a plant monitorable is when its panels are being designed.
Planning a new MCC, PCC or APFC panel, or upgrading an existing one for better visibility? Contact our engineering team with your single-line diagram, critical loads and monitoring goals. Call +91 96019 65426 or email info@synchroelectricals.in.
FAQs
1. What is predictive maintenance in electrical systems?
Predictive maintenance means servicing equipment based on its measured condition rather than a fixed calendar or waiting for failure. In electrical systems, it uses data such as current, voltage, harmonics, temperature and insulation condition to spot deterioration early and schedule repairs before a breakdown.
2. How can electrical data predict equipment failure?
Many faults change how equipment draws or carries power before they cause a failure. A worn bearing can raise motor current, a deteriorating connection can unbalance phases and heat a joint, and ageing capacitors deliver less kVAr. Tracking these values against a healthy baseline shows deterioration while there is still time to act.
3. What is the difference between preventive and predictive maintenance?
Preventive maintenance follows a schedule, servicing equipment at fixed intervals whether it needs it or not. Predictive maintenance acts on the equipment’s actual condition. Most plants use both: preventive routines for basics such as cleaning and tightening, and predictive monitoring to target critical assets.
4. What is motor current signature analysis (MCSA)?
MCSA analyses the frequency content of a motor’s supply current to detect faults inside the motor and its driven load. Broken rotor bars, eccentricity and some bearing defects create characteristic frequency components. Because current can be measured at the MCC, the motor itself doesn’t need to be accessed or stopped.
5. Can an energy meter predict motor failure?
A standard energy meter or MFM can show warning trends such as rising current at the same load, phase unbalance and voltage problems. It cannot perform detailed fault diagnosis such as MCSA, which needs high-speed sampling and spectrum analysis. Meters give early indications; dedicated diagnostic tools confirm the cause.
6. What causes current unbalance in a three-phase motor?
Common causes are unbalanced supply voltage, a loose or corroded connection in one phase, a failing contactor contact, and winding insulation damage. Supply voltage unbalance is the most frequent cause, because a small voltage unbalance produces a much larger current unbalance in the motor.
7. How much voltage unbalance is acceptable for motors?
NEMA MG 1 recommends keeping voltage unbalance at motor terminals within 1%. Beyond that, motors should be derated, and operation above 5% is not recommended. Check the motor manufacturer’s guidance for specific limits.
8. Why do motors overheat even when current is within rating?
Voltage unbalance, harmonics, poor ventilation, high ambient temperature and frequent starts all add heat without necessarily pushing average current above nameplate. Monitoring per-phase current, voltage balance, THD and starts per hour often explains overheating that a simple ammeter reading doesn’t.
9. How do harmonics damage electrical equipment?
Harmonic currents add heating to transformers, cables, neutral conductors and motors. They also overload capacitors, which have lower impedance at higher frequencies. Over time this shortens equipment life and can cause nuisance tripping. Monitoring THD shows when mitigation, such as detuned APFC reactors or harmonic filters, is needed.
10. How can I tell if APFC capacitors are failing?
Warning signs include the panel failing to reach its target power factor, more steps switching in than before, lower measured kVAr per step, capacitor bulging or overheating, and repeated fuse failures. A logged PF and kVAr trend at the incomer usually shows the decline before it becomes a billing problem.
11. What causes busbar joints to overheat?
Loose bolts, inadequate torque, oxidised or contaminated contact surfaces, undersized joints and overloading all raise contact resistance and temperature. Heat speeds up oxidation, so the problem gets worse over time. Continuous temperature monitoring at critical joints catches this before it becomes a fire or arc risk.
12. Is continuous thermal monitoring better than periodic thermography?
They serve different purposes. Periodic thermography surveys a wide area cheaply but only shows conditions on the inspection day, usually with panels opened. Continuous sensors watch critical points around the clock and catch problems between surveys. Many plants use thermography broadly and continuous sensors on their most critical joints.
13. What is partial discharge, and why does it matter?
Partial discharge is a small electrical discharge across a defect in HT insulation that doesn’t fully bridge the conductors. It gradually erodes the insulation and can lead to complete breakdown. Monitoring PD activity in HT cable terminations and switchgear gives early warning of insulation failure.
14. Can VFD data help with predictive maintenance?
Yes. Drives log output current, torque, heatsink temperature, DC bus voltage and fault history. Rising heatsink temperature at steady load often points to cooling problems, and changes in torque or current at fixed speed reflect the condition of the driven machine.
15. What data should be recorded at commissioning for predictive maintenance?
Record running current at known load for each major motor, phase voltages and currents, voltage unbalance, THD at the incomer, APFC step currents, starting times, and joint or termination temperatures under load. These readings are the healthy baseline that later trends are compared against.
16. How often should electrical data be logged?
For trend monitoring, intervals from a few seconds to a few minutes are typical, depending on the parameter and storage capacity. Events such as trips, starts and alarms should be logged as they happen. Waveform analysis such as MCSA uses short high-speed captures taken periodically, not continuous logging.
17. How do I set alarm thresholds?
Base thresholds on each asset’s own baseline and the manufacturer’s limits, not generic values. Use two stages: a warning level for investigation and a critical level for planned intervention. Review thresholds after the first few months to cut false alarms.
18. Which equipment should be monitored first?
Start with assets whose failure would stop production or create safety risk: main incomers, the largest and most critical motors, the APFC panel, critical busbar joints and backup power systems. Expand monitoring as your team builds confidence and response routines.
19. Can monitoring be added to existing panels?
Often yes. Meters can be added where door and terminal space allows, split-core CTs can be fitted around existing cables, and wireless temperature sensors suit many busbar joints. Crowded or ageing panels may need a separate monitoring enclosure, or a planned panel upgrade that builds monitoring in properly.
20. Does real-time monitoring replace routine maintenance?
No. Cleaning, tightening, insulation resistance testing, protection relay testing and vibration analysis remain essential. Real-time electrical data helps prioritise this work and catches problems between scheduled visits.
21. Is electrical condition monitoring the same as protection?
No. Protection devices such as breakers, fuses and relays disconnect faults quickly to limit damage. Condition monitoring watches slow trends to predict faults before they happen. Both are needed, and monitoring alarms should never be relied on in place of correctly rated protection.
22. What information should I share when ordering panels with monitoring provisions?
Share your single-line diagram, critical loads, the parameters you want monitored, the communication protocol and software you plan to use, and any sensor requirements such as busbar temperature or PD monitoring. Include consultant or tender specifications so the monitoring provisions match your plant’s needs from the start.